Dollar cost averaging (DCA) QFL IndicatorAs investors, we often face the dilemma of willing high stock prices when we sell, but not when we buy. There are times when this dilemma causes investors to wait for a dip in prices, thereby potentially missing out on a continual rise. This is how investors get lured away from the markets and become tangled in the slippery slope of market timing, which is not advisable to a long-term investment strategy.
Skyrex developed a complex indicator based on dollar-cost averaging in Quick Fingers Luc's interpretation. It is a combinations of strategies which allows to systematically accumulate assets by investing scaled amounts of money at defined market cycle global support levels. Dollar-cost averaging can reduce the overall impact of price volatility and lower the average cost per asset thus even during market slumps only a small bounce is required to reach take profit.
The indicator script monitors a chart price action and identifies bases as they form. When bases are reached the script provides entry alerts. During price action development an asset value can go lower and in this way the script will perform safety entries alerts at each subsequent accumulation levels. When weighted average entry price reaches target profit the script will perform a take profit action alert.
Bases are identified as pivot lows in a fractal pattern and validated by an adjustable decrease/rise percentage to ensure significancy of identified bases. To qualify a pivot low, the indicator will perform the following validation:
Validate the price rate of change on drops and bounces is above a given threshold amount.
Validate the volume at the low pivot point is above the volume moving average (using a given length).
Validate the volume amount is a given factor of magnitude above is above the volume moving average.
Validate the potential new base is not too close to the previous range by using a given price percent difference threshold amount.
A fractal pattern is a recurring pattern on a price chart that can predict reversals among larger, more chaotic price movements. These basic fractals are composed of five or more bars. The rules for identifying fractals are as follows:
A bearish turning point occurs when there is a pattern with the highest high in the middle and two lower highs on each side.
A bullish turning point occurs when there is a pattern with the lowest low in the middle and two higher lows on each side.
Basic dollar-cost averaging approach is enhances by implementation of adjustable accumulation levels in order to provide opportunity of setting them at defined global support levels and Martingale volume coefficient to increase averaging effect. According to Quick Fingers Luc's principles trading principles we added volume validation of a base because it allows to confirm that the market is resistant to further price decrease.
The indicator supports traditional and cryptocurrency spot, futures, options and marginal trading exchanges. It works accurately with BTC, USD, USDT, ETH and BNB quote currencies. Best to use with 1H timeframe charts and limit orders. The indicator can be and should be configured for each particular asset according to its global support and resistance levels and price action cycles. You can modify levels and risk management settings to receive better performance
Advantages of this indicator:
The indicator has custom alert settings for each strategy action
The indicator can be used with 3Commas, Cryptohopper, Alertatron or Zignaly bots
The indicator is sustainable to market slumps and can be used for long-term trading
The indicator provides a large number of entries which is good for diversification
Can be applied to any market and quote currency
Easy to configure user interface settings
How to use?
1. Apply indicator to a trading pair your are interested in using 1H timeframe chart
2. Configure the indicator: change layer values, order size multiple and take profit/stop loss values according to current market cycle stage
3. Set up a TradingView custom alert using the indicator settings to trigger on a condition you are interested in
4. The indicator will send alerts when to enter and when to exit positions which can be applied to your portfolio using external trading platforms
5. Update settings once market conditions are changed using backtests on a monthly period
在脚本中搜索"take profit"

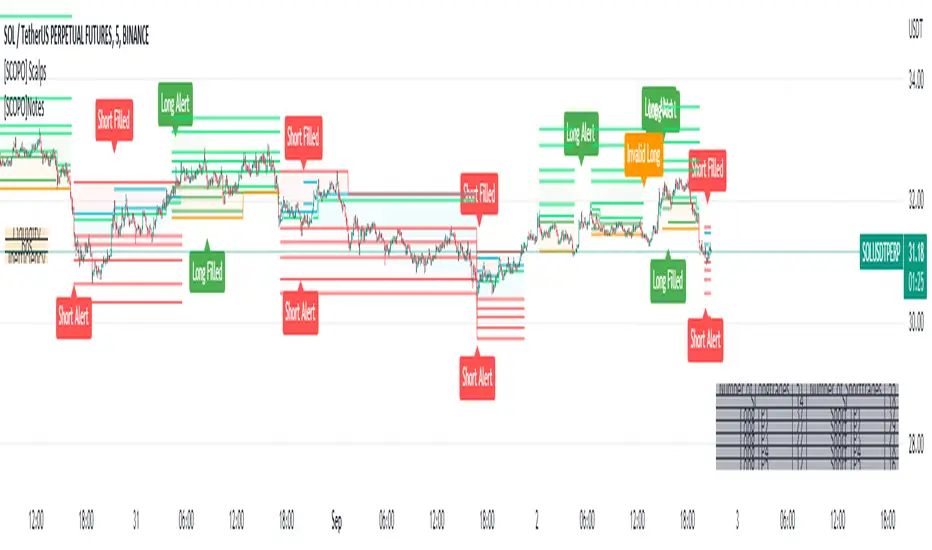
[SCOPO]Scalping BotEnglish, German is found Below
Scalping Indicator (5min Mostly)
- An Indicator that Creates Possible Trades, created on MA's, Volumebased Support and Ressistance and MACD, The Take Profits are created by a Simple Support and Ressitance Indicator (Built In)
- The Indicator sends with the Alert Function Buy and Sell Signals
- These Signals exists from 3 Entrys, 5 Take Profits and 1 Additional Take Profit who should be used after Entry 2/3 has been filled
- If a Signal gets Invalid or an Entry has been filled ,there comes a new Alert
- The Indicator Plots Lines on the Chart for TP/SL and has an Integrated Backtester table
If you got Questions pls Contact me via PM!
Update Rolled out Today (2.9.2022)
- Its now possible to set your own choosen minimal TP, before was 0.3 % and the next Ressistance above would have been taken for longs
- FilterMA can now be choosen from Different MA's via Dropdown menu
- Length of FilterMA can now be set by user
- Those Changes have been done to make it usefull for higher Timeframes too
German
Scalping Indikator
- Kurzbeschreibung: Ein Indikator der mit EMA & Macd und Volumenbasierten Supports/Ressistance Long - & Shorttrades vorschlägt
- Der Indikator sendet mit der Alarm Funktion Kauf und Verkaufsignale
Diese Signale bestehen aus 3 Entrys, 5 Take Profits sowie 1 Additional Take Profit der Aktiv wird nachdem der Entry 2 / 3 gefüllt wurde
Sollte ein Signal Invalidiert werden dann kommt ein erneuter Alarm
Sollte der 1.Entry gefüllt werden dann kommt auch ein Alarm
- Der Indikator gibt visuell auf dem Chart Linien für TP/SL wieder und besitzt auch ein Integriertes Info Fenster für ehemalige Trades.
- Die TP's werden durch eine eingebaute Support/Ressistance Funktion ausgewählt.
Alle verbesserungsvorschläge bitte per PN an @ridicolous
Update vom 2.9.2022
- Es wurde die möglichkeit mindest TP's zu setzen hinzugefügt
- Die FilterEMA kann nun aus einer Auswahl verschiedener MA's ausgewählt werden
- FilterMA längen können nun angepasstwerden
- Diese Aenderungen wurden hinzugefügt um das Skript auch auf höheren Timeframes laufen lassen zu können
SuperTrend Entry(My goal creating this indicator) : Provide a way to enter the market systematically, automatically create Stop Loss Levels and Take Profit Levels, and provide the position size of each entry based on a fix Percentage of the traders account.
The Underlying Concept :
What is Momentum?
The Momentum shown is derived from a Mathematical Formula, SUPERTREND. When price closes above Supertrend Its bullish Momentum when its below Supertrend its Bearish Momentum. This indicator scans for candle closes on the current chart and when there is a shift in momentum (price closes below or above SUPERTREND) it notifies the trader with a Bar Color change.
Technical Inputs
- If you want to optimize the rate of signals to better fit your trading plan you would change the Factor input and ATR Length input. Increase factor and ATR Length to decrease the frequency of signals and decrease the Factor and ATR Length to increase the frequency of signals.
Quick TIP! : You can Sync all VFX SuperTrend Indicators together! All VFX SuperTrend indicators display unique information but its all derived from that same Momentum Formula. Keep the Factor input and ATR Length the same on other VFX SuperTrend indicators to have them operating on the same data.
Display Inputs
- The indicator has a candle overlay option you can toggle ON or OFF. If toggled ON the candles color will represent the momentum of your current chart ( bullish or bearish Momentum)
your able to change the colors that represent bullish or bearish to your preference
- You can toggle on which shows the exact candle momentum switched sides
your able to change the colors that represent a bullish switch or bearish switch to your preference
- The trader can specify which point you would like your stop loss to reference. (Low and High) Which uses the Low of the Momentum signal as the reference for your Stop Loss during buy signals and the High as the reference during sell signals. Or (Lowest Close and Highest Close) which uses the Lowest Close of the Momentum signal as the reference for your Stop Loss during buys and the Highest Close as the reference during sells.
- The colors that represent your Stop Loses and Take Profits can also be changed
Risk Management Inputs
- Your Risk MANAGMENT section is used to set up how your Stop Loss and Take Profit are calculated
- You have the option to take in account Volatility when calculating your Stop Loss. A adjusted ATR formula is used to achieve this. Increase Stop Loss Multiplier from 0 to widen stops.
- Increase Take Profit Multiplier from 0 to access visual Take Profit Levels based on your Stop Loss. This will be important for traders that Prefer trading using risk rewards. For Example: If the the Take Profit Multiplier is 3 a Take Profit level 3 times the size or your stop loss from your entry will be shown and a price number corresponding to that Take Profit Level becomes available.
- Enter your current Account size, Bet Percentage and Fixed Spread to get your Position Size for each trade
-Toggle on the Current Trade Chart and easily get the size of your Position and the exact price of your Take Profit and Stop Loss.
You can increase the Size of the Current Trade Chart= Tiny, Small, Normal, Large, Huge and change the Position of the Current
trade Chart to your preference, (Top- Right, Center, Left) (Middle- Right, Center, Left) (Bottom- Right, Center, Left).
How it can be used ?
- Enter Trades and always know where your stop is going to be
- Eliminate the need to manual calculate Position Size
- Get a consistent view of the current charts momentum
- Systematical enter trades
- Reduce information overload

Unicorn X-AlgoUnicorn X-Algo is a multifunctional trading indicator. It is designed to help traders make real-time decisions using quantitative models.
Its core is a trend trading strategy based on our enhanced Trailing Stop-Loss algorithm. This strategy provides the user with position entry and exit signals. It is customizable and has a built-in instant backtesting feature.
For those who have difficulty with finding the good settings the indicator has the Automatic Mode. In this mode, there is no need for the user to adjust any settings. The indicator calculates optimized trading signals automatically.
In addition, the indicator provides a number of useful tools that aim to provide additional confirmation to the trading signals. They include: support and resistance levels forecast, price range prediction and institutional activity detection.
The script can send real-time alerts to the user’s Email and to the cell phone via notifications in the TradingView app.
The indicator can be used for various types of trend and swing trading, including positional trading, day trading and scalping.
Unicorn X-Algo allows users to:
forecast direction of trends with BUY and SELL signals;
determine the right time to close a position;
detect institutional activity in the market;
forecast key support and resistance levels;
predict the future price range for any market;
customize any settings and do a backtest with one click;
see historical trades on the chart;
use the fully Automatic Mode where the algorithm optimizes all its settings itself.
When using this script, keep in mind that past results do not necessarily reflect future results and that many factors influence trading results.
FEATURES
Trading signals
The feature calculates trend or swing entry and exit signals. The underlying strategy does not use fixed Take-Profit levels. It trails the price with a Trailing Stop-Loss to get as many pips as possible from price movements.
The feature is based on our custom Volatility Stop algorithm. It uses linear regressions instead of averaging. As our practice shows, this helps to reduce signal lag while keeping the number of false signals low.
Trading signals are customizable with Sensitivity and Trade Length parameters which determine the trading signals frequency and width of the Trailing-Stop levels, respectively.
Automatic Mode
The Trading Signals function has an automatic mode. When it is turned on, you do not need to adjust the trading signals settings. The algorithm tries to calculate the best settings automatically using an optimization algorithm.
In this mode, Buy and Sell signals are displayed as green and red triangles respectively. There are two types of exit signals displayed as circles and crosses. A circle signal means that a price reversal is expected and you can partially close the position. A cross signal means that a trading signal in the opposite direction is expected soon and you can partially or completely close your position.
Support and Resistance Levels
Support/Resistance levels forecasting model. The forecasted levels are non-repainting. Once calculated for a specified period in the future (day, week, month, etc.), they don't change during this period.
The feature allows the trader to plan trades and use the forecasted levels as entry levels and targets for opening and closing positions. Both intraday and higher timeframes are supported.
The forecasting model analyses the distribution of the price time series to find clusters in the data. These clusters are then used to make the key price levels forecast.
Big Money Activity detection
The Big Money Activity tool identifies areas on the price chart associated with instructional traders' activity in the market.
Institutional activity in a trending market can be a leading signal for upcoming reversal. Institutions could be fixing their profit, causing the price to move against the current trend.
Institutional activity in a sideways market can be due to positions accumulation and signal a new trend formation.
The algorithm uses tick volume, volume, and volatility data to forecast activity of institutional investors. The method develops the idea described in the Daigler & Wiley (2015) and Shalen (1993) works. It says that when institutional traders actively open or close their positions in the market, a divergence between volume and volatility time-series arises. It can be due to their use of position-splitting algorithms that reduce the impact of their positions on the market.
Trading Range Forecast
Trading Range Forecast feature predicts the price range of an asset for a selected period of time in the future, called Forecast Horizon. It can be the next day or 12-hour trading session. This function works if your chart timeframe is intraday (i.e. the timeframe below "D"). It shows the upper and lower bounds between which the price is going to stay in the upcoming Forecast Horizon period.
Instant Backtesting
After changing any settings, you can immediately see the performance of the strategy on the Instant Backtesting panel. Two metrics are displayed there - the percentage of profitable trades and the total return. This information, as well as the historical trades shown on the chart, will help you quickly and easily evaluate any settings you make.
SETTINGS
TRADING SIGNALS
Trade Length - defines the length of the trades the algorithm tries to make. Recommended values are from 1.0 to 6.0.
Sensitivity - controls the sensitivity of the trading signals algorithm. The sensitivity determines the density of trading signals and how close the trailing-stop levels follow the price. The higher the value of this parameter is, the less sensitive the algorithm is. High values of the Sensitivity parameters (100-500) can help to withstand large price swings to stay in longer price moves. Lower values (10-100) work well for short- and medium-term trades.
TRADING TOOLS
Big Money Activity - turns on and off the identification of the areas associated with institutional traders activity.
SUPPORТ AND RESISTANCЕ LEVELS
Show Support And Resistance Levels - turns on and off support and resistance levels calculation.
TRADING RANGE FORECAST
Show Trading Range Forecast - turns on/off trading range forecasting
Forecast Horizon - sets the period for which the trading range forecast is made
Forecasting Method - allows to choose a forecasting algorithm for the trading range forecast.
BACKTESTING
Use Starting Date - turns on/off the starting date for the strategy and backtests. When off, all available historical data is used.
Starting Date - sets the starting date for the strategy and backtests.
Show Instant Backtesting Dashboard - turns on/off a dashboard that shows the current strategy performance: the percentage of profitable trades and total return.
Leverage - sets the leverage that the strategy uses.

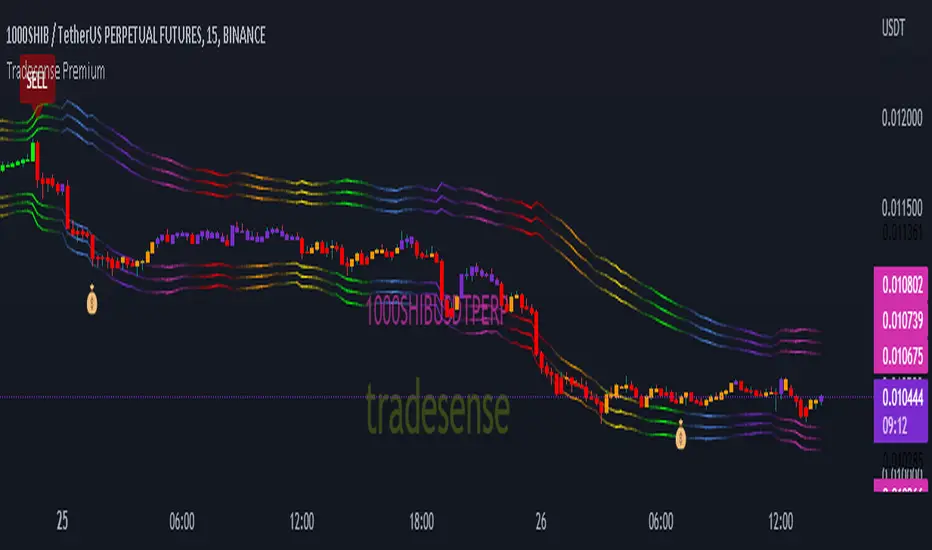
Tradesense PremiumTradesense Premium
Tradesense Premium indicator offers a buy & sell signal that is based from our senior analyst who have more than 10years of experience in Forex, Stock and Crypto trading and made it possible by our pine script developers.
Our script can detect market volatility based on the price direction and the absolute value of exponential moving average are multiplied to specific numbers to get a different trading style such as Scalper, Swing Trader and Trend Follower. We also filtered out all the signals using a different known indicators such as RSI, ATR, and ADX, and the results will allow you to enter a trade before the big moves occur. We also included all the important indicator which appears in real-time to get a competitive advantage in any market environment.
If you are a trader for a long time you should know that there is no way to avoid risk in trading. Every single trade could, theoretically at least, end up a loser. That is why our script also provides automatic risk management system which can gives you the ability to know exactly where to take the profit and to stop.
Trading style preset options - Will allows you to get the signals the way you wanted depending on your trading style. Ex. Scalper, Swing Trader or a Trend follower.
Bar color - Our bar colors are based on the price actions which detects the weakness of the bar or if the bar is ranging.
Reversal Zone - This indicator would identify possible price reversal zones.
Support & Resistance - This indicator draw a line at the pivot point to show possible support and resistance area.
Target Profit indicator based on price actions - This indicator will gives you an option to reduce your position or go out of the trade before the reversal happens.
Target Profit / Stop Loss based on ATR - This indicator will gives you a simple but effective risk management system to protect your capital. The TP/SL is based from the ATR.
Alert System - We are giving you an options to customize your alerts.
Our mission is to provide systematic way to build your success.
Release notes: Tradesense Premium V1.1
✅Trading style preset options
✅Bar color
✅Reversal Zone
✅Support & Resistance
✅Target Profit indicator based on price actions
✅Target Profit / Stop Loss based on ATR
✅Alert System
❓Trading style
Currently we have 3 sets of preset options that the user can use.
Scalp - this preset is made for the trader that wants a quick in and out of the trade. The best timeframe to this is 1min to 5mins chart.
Swing - this preset is for the trader who can wait a little bit longer in a trade. The best timeframe to use is 15mins to 1hour chart.
Trend - this preset is made for the busy people that can hold a trade more than a day. The best timeframe to use is 4hours to 1day chart.
❓Bar color
This options will change the color of your bars to lessen the noise of your chart.
Green Color is a bullish indicator
Red Color is a bearish indicator
Orange Color will signify that the trend is weakening
Purple Color is a consolidation/ranging price action
❓Reversal Zone
From the name it self, once the price is already hit the Reversal Zone the price will more likely to reverse or will make a correction.
❓Support & Resistance
When this option is enabled, the support and resistance levels will show up.
❓Target Profit indicator based on price actions
When this option is enabled, you will see a "💰" which means it's time to take profit or reduce your positions.
❓Target Profit / Stop Loss based on ATR
Most of the trader uses ATR as a stop loss level. When this option is enabled, the indicator for Stop Loss and Take Profit will show up and the TP/SL levels can be changed by changing the ATR Multiplier (Default is 1.8).
❓Alert System
Function alert is added and the user can customize it the way they want it.
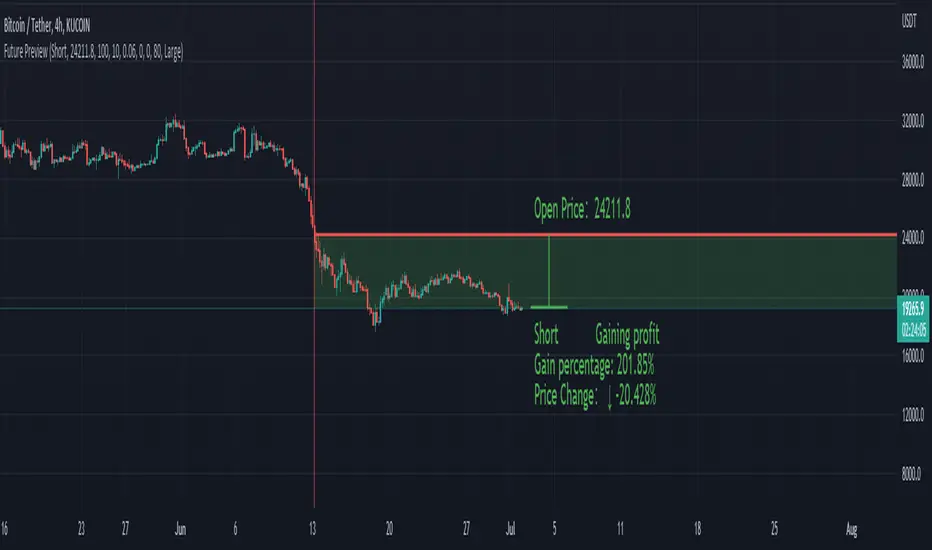
Future PreviewFuture Preview
Calculate real-time future order profit with open price, leverage and commission fee. Simple and straight forward. If you need any additional feature, please leave a comment below. I am glad to help.
Usage:
When adding Future Preview to chart, it will ask order open time and open price on the chart by clicking with left mouse on the desired value. These value can be changed lately, as well as the leverage and commission fee. Default leverage is 10 and default commission fee is 0.06% (taker).
There will be two horizontal lines. The solid longer line is the open price line, it shows the order open price. The shorter line moving with real-time price is the current price line, it shows the current price. There will be preview data shows on top or below the price line. Open price line is red for short order and green for long order. The current price line is red when the order is losing and it is green when it profiting. The back ground color follows the color of current price line. Background color transparency and gain/loss color can be changed in options.
There will be one horizontal line on the left if the option of showing open time is on (default is on). It shows the time stamp when current order opened.
After adding Future Preview to chart, there is option to add Taking Profit(TP) or Stop Loss(SL) to the chart.
Font size can be changed in option
MPF EMA Cross Strategy (8~13~21) by Market Pip FactoryThis script is for a complete strategy to win maximum profit on trades whilst keeping losses at a minimum, using sound risk management at no greater than 1.5%
The 3x EMA Strategy uses the following parameters for trade activation and closure.
1/ Daily Time Frame for trend confirmation
2/ 4 Hourly Time Frame for trend confirmation
3/ 1 Hourly Time Frame for trend confirmation AND trade execution
4/ 3x EMAs (Exponential Moving Averages)
* EMA#1 = 8 EMA (Red Color)
* EMA#2 = 13 EMA (Blue Color)
* EMA#3 = 21 EMA (Orange Color)
5/ Fanning of all 3x EMAs and CrossOver/CrossUnder for Trend Confirmation
6/ Price Action touching an 8 EMA for trade activation
7/ Price Action touching a 21 EMA for trade cancellation BEFORE activation
* For LONG trades: 8 EMA would be ABOVE 21 EMA
* For SHORT trades: 8 EMA would be BELOW 21 EMA
* For trade Cancellation, price action would touch the 21 EMA before trade is activated
* For trade Entry, price action would touch 8 EMA
Once trigger parameter is identified, entry is found by:
a) Price action touches 8 EMA (Candle must Close for confirmed Trade preparation)
b) Trade preparation can be cancelled before trade is activated if price action touches 21 EMA
c) Trailing Stop Loss can be used (optional) by counting back 5 candles from current candle
CLOSURE of a Trade is identified by:
e) 8 EMA crossing the 21 EMA, then close trade, no matter LONG or SHORT
f) Trail Stop Loss
IMPORTANT:
g) No more than ONE activated trade per EMA crossover
h) No more than ONE active trade per pair
NOTE: This strategy is to be used in conjunction with Cipher Twister (my other indicator) to reduce trades on
sideways price action and market trends for super high win ratio.
NOTE: Enabling of LONGs and SHORTs Via Cipher Twister is done by using the previous
green or red dot made. Additionally, when the trend changes, so do the dot's validity based
on being above or below the 0 centerline.
----------------------------
Strategy and Bot Logic
----------------------------
.....::: FOR SHORT TRADES ONLY :::.....
The Robot must use the following logic to enable and activate the SHORT trades:
Parameters:
$(crossunder)=8EMA,21EMA=Bearish $(crossover)=8EMA,21EMA=Bullish $entry=SELL STOP ORDER (Short)
$EMA#1 = 8 EMA (Red Color) $EMA#2 = 13 EMA (Blue Color) $EMA#3 = 21 EMA (Orange Color)
Strategy Logic:
1/ Check Daily Time Frame for trend confirmation if:
(look back up to 50 candles - find last cross of EMAs)
$(chart)=daily and trend=$(crossunder) then goto 2/ *Means: crossunder = ema21 > ema8
$(chart)=daily and trend=$(crossover) then stop (No trades) *Means: crossover = ema8 > ema21
NOTE: This function is switchable. 0=off and 1=on(active). Default = 1 (on)
2/ Check 4 Hourly Time Frame for trend confirmation if:
(look back up to 50 candles - find last cross of EMAs)
$(chart)=4H and trend=$(crossunder) then goto 3/ *Means: crossunder = ema21 > ema8
$(chart)=4H and trend=$(crossover) then stop (No trades) *Means: crossover = ema8 > ema21
NOTE: This function is switchable. 0=off and 1=on(active). Default = 1 (on)
3/ 1 Hourly Time Frame for trend confirmation AND trade execution if:
(look back up to 50 candles - find last cross of EMAs)
$(chart)=1H and trend=$(crossunder) then goto 4/ *Means: crossunder = ema21 > ema8
$(chart)=1H and trend=$(crossover) then stop (No trades) *Means: crossover = ema8 > ema21
4/ Trade preparation:
* if Next (subsequent) candle touches 8EMA, then set STOP LOSS and ENTRY
* $stoploss=3 pips ABOVE current candle HIGH
* $entry=3 pips BELOW current candle LOW
5/ Trade waiting (ONLY BEFORE entry is hit and trade activated):
* if price action touches 21 EMA then cancel trade and goto 1/
Note: Once trade is active this function does not apply !
6/ Trade Activation:
* if price activates/hits ENTRY price, then bot activates trade SHORTs market
7/ Optional Trailing stop:
* if active, then trailing stop 3 pips ABOVE previous HIGH of previous 5th candle
or * Move Stop Loss to Break Even after $X number of pips
NOTE: This means count back and apply accordingly to the 5th previous candle from current candle.
NOTE: This function is switchable. 0=off and 1=on(active). Default = 0 (off)
8/ Trade Close ~ Take Profit:
* Only TP when
$(chart)=1H and trend=$(crossover) then close trade ~ Or obviously if Stop Loss is hit if 7/ is activated.
----------END FOR SHORT TRADES LOGIC----------
.....::: FOR LONG TRADES ONLY :::.....
The Robot must use the following logic to enable and activate the LONG trades:
Parameters:
$(crossunder)=8EMA,21EMA=Bearish $(crossover)=8EMA,21EMA=Bullish $entry=BUY STOP ORDER (Long)
$EMA#1 = 8 EMA (Red Color) $EMA#2 = 13 EMA (Blue Color) $EMA#3 = 21 EMA (Orange Color)
Strategy Logic:
1/ Check Daily Time Frame for trend confirmation if:
(look back up to 50 candles - find last cross of EMAs)
$(chart)=daily and trend=$(crossover) then goto 2/ *Means: crossover = ema8 > ema21
$(chart)=daily and trend=$(crossunder) then stop (No trades) *Means: crossunder = ema21 > ema8
NOTE: This function is switchable. 0=off and 1=on(active). Default = 1 (on)
2/ Check 4 Hourly Time Frame for trend confirmation if:
(look back up to 50 candles - find last cross of EMAs)
$(chart)=4H and trend=$(crossover) then goto 3/ *Means: crossover = ema8 > ema21
$(chart)=4H and trend=$(crossunder) then stop (No trades) *Means: crossunder = ema21 > ema8
NOTE: This function is switchable. 0=off and 1=on(active). Default = 1 (on)
3/ 1 Hourly Time Frame for trend confirmation AND trade execution if:
(look back up to 50 candles - find last cross of EMAs)
$(chart)=1H and trend=$(crossover) then goto 4/ *Means: crossover = ema8 > ema21
$(chart)=1H and trend=$(crossunder) then stop (No trades) *Means: crossunder = ema21 > ema8
4/ Trade preparation:
* if Next (subsequent) candle touches 8EMA, then set STOP LOSS and ENTRY
* $stoploss=3 pips BELOW current candle LOW
* $entry=3 pips ABOVE current candle HIGH
5/ Trade waiting (ONLY BEFORE entry is hit and trade activated):
* if price action touches 21 EMA then cancel trade and goto 1/
Note: Once trade is active this function does not apply !
6/ Trade Activation:
* if price activates/hits ENTRY price, then bot activates trade LONGs market
7/ Optional Trailing stop:
* if active, then trailing stop 3 pips BELOW previous LOW of previous 5th candle
or * Move Stop Loss to Break Even after $X number of pips
NOTE: This means count back and apply accordingly to the 5th previous candle from current candle.
NOTE: This function is switchable. 0=off and 1=on(active). Default = 0 (off)
8/ Trade Close ~ Take Profit:
* Only TP when
$(chart)=1H and trend=$(crossunder) then close trade ~ Or obviously if Stop Loss is hit if 7/ is activated.
----------END FOR LONG TRADES LOGIC----------
IMPORTANT:
* If an existing trade is already open for that same pair, & price action touches 8EMA, do NOT open a new trade..
* bot must continuously check if a trade is currently open on the pair that triggers
* New trades are to be only opened if there is no active trade opened on current pair.
* Only 1 trade per pair rule !
* 5 simultaneous open trades (not same pairs) default = 5 but value can be changed accordingly.
* Maximum risk management must not exceed 1.5% on lot size
*** Some features are not yet available autoated, they will be added in due course in subsequent version updates ***

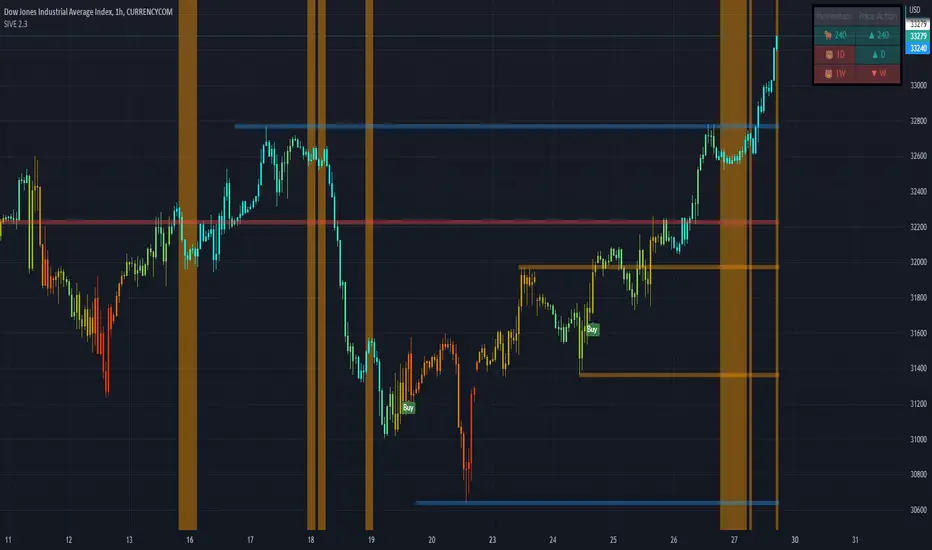
SIVE 2.0 - [Soldi]SIVE 2.0 IS FINALLY HERE, after the long awaited update we are finally able to bring to you SIVE 2.0!
SIVE 1.0 (Systematic Institutional Volatility Expansion) brought a whole new approach to the algorithm and retail trading game on TradingView. Never before have you had access to a quantitative institutional approach like this, after years in development and testing we finally brought SIVE 1.0 to market. With very very high demand, support and so much positive feedback we knew that what we've created really hit the mark for so many traders!
What is SIVE?
SIVE as stated above stands for, Systematic Institutional Volatility Expansion. What this means is we have a highly effective system that reads what institutional algorithms are proven to be looking at. While only providing alerts during periods where Volatility is Expanding
We don't shy away from volatility here, that is where the bread and butter lays. volatility is a double edged sword that not many people know how to effectively use to their advantage. Simply put, because they are told in their retail trading that volatility is risky, and that you should stay away from volatile products. I say embrace it with the right tools.
What Has Changed?
At the core, SIVE 2.0 brings more efficient calculations to the volatility modelling as well as the triggering of trades!
Trend Scalper - This is a sub-set strategy we have included, what it measures is 'Super Trend' with a deviation of 7 and the MTI ribbon crosses. This is to be used as a way to scalp and trade the momentum of the market. I am aware that another brand/community has put this out as a paid feature to their algorithm. Since they didn't want to credit me for my contribution I decided to release it for free and also add it here. This is listed in my scripts as a free to use access.
Volatility Confluence - We have now also added a feature where you can choose how many volatility models you want to be aligned before SIVE calls an alert. There are a total of 9 models we have included, example. You choose 3 'Volatility Confluence', this means that SIVE will only call alerts when 3 of those 9 models agree. This can be very effective if you want to have more refined volatility trades, giving you more confidence that an expansion will take place.
Low Volatility Flashes - You now have the ability to control the low volatility back ground flash feature that was included with SIVE 1.0
Volatility Candles - You can now plot the volatility strength as candles! before you weren't able to see the actual underlaying volatility . Till now, turn this on and watch it turn you candles into a colourful array of the rainbow based on the volatility . Note - You will either need to *bring to front* or turn off the price data to see it
Take Profit System (beta) - Before on SIVE 1.0 and in the beta versions we had an early version of the money management. Where based on the ATR on the trade it would give you a suggested Stop Loss and Take Profit area. Now we have completely over hauled that and re calculated how we approach this also giving the trader 2 different options to choose from for suggested Stop Loss placement. We also included a 'Dynamic Take Profit' system that's based on the MTI to give you momentum based Take Profits. These are still in beta stages so any feedback is much appreciated and as always will be reviewed and considered.
RSI bands - Reverse plot the RSI onto your chart. Plot the over sold and over Bought static lines to price!
Moving Average Filter ( Multi Time Frame ) - Introducing a way further refine the trade alerts and give more power into the traders hands. We know that many many traders like to only trade if example. price is Greater Than 200 EMA. We wanted to give traders a choice to refine the trade alerts based on this information. You can choose between 'Price vs MA' - which is explained in that example just provided. The other option is 'MA vs MA', this allows you to filter out trades based on if a Moving Average of your choice(MA1) is Greater than MA2. With all this we also provided Multi Time Frame accessibility to just further give the trader more control and range. You also have the ability to just plot the Moving averages and not filter the trades at all!
Kill Zone / Time Sessions - Including another free script that has already been posted to my account. This script is also unique as it plots the specified time zones 24 hours in advanced . If you trade example. 'New York Session', Instead of using an indicator that only shows you after the fact it happens. You can now plot that time zone 24 Hours in advanced and watch how price trades to it and interacts with it. It has 4 completely customizable Time Zone slots. Please adjust to your time zone and desired sessions.
Here are some examples of SIVE working across various charts with the different features
USDCAD - 1 Hour
Take Profit System
XAUUSD ( Gold ) - 15 min
Trend Scalper System
US30(Dow Jones) - 15 min
Volatility Candles + Low Volatility Flashes
BTCUSD ( Bitcoin ) - 1 hour
Support / Resistance + Dashboard + Multi Time Frame MTI
USOIL (WTI Crude Oil ) - 5m
Kill Zones + Moving Average Filter
APPL( Apple ) - 1 hour
Moving Average Filter
Trend Friend - Swing Trade & Scalp Signals - Stocks Crypto ForexTREND FRIEND is a custom built, data driven algorithm that gives buy and sell signals when many different factors line up together on a single candle. It is designed to catch every move so you can expect early entries and exits across all of your favorite markets. Use scalp mode for early entries with lots of signals or swing mode for longer swings with fewer signals and long swing mode for really long swing trades with even less signals.
The best markets to use this indicator on are high volume tickers with a lot of price action as these markets have enough data to use to give the signals the algo needs to be able to detect highly probable moves in price. That being said, it works across all markets such as stocks, crypto, forex and futures and across all timeframes(on really long timeframes it may not give signals due to not having enough data to work with).
***MAJOR POINTS TO REMEMBER BEFORE USING THIS INDICATOR***
The algo is designed to catch major moves, so if a signal seems to come in late, it is highly likely the market is about to reverse so use caution when taking signals that seem late. This typically happens because the market is indecisive so always be careful in these situations and just wait for a better signal when markets are really decisive.
Always trade in the direction of the trend meaning the volume weighted moving average clouds. There is also a trend detection label and risk level label that you should follow to keep your trades as safe as possible. The safest way to do this is only trade short when the VWMA 100 is below the VWMA 500 and a Bear signal comes in very close to a VWMA line. Only trade long when the VWMA 100 is above the VWMA 500 and a Bull signal comes in very close to a VWMA line.
If price is between the moving averages, play the VWMA 100 and VWMA 500 as support and resistance and only take signals near one of the VWMAs with the plan of price returning to the other VWMA. If you are taking trades against the trend, like trying to buy the dips or sell the tops, wait for price to cross the VWMA 100 before following a signal.
If the VWMA 100 and VWMA 500 are close to each other and/or moving sideways, you can expect choppy price action and consolidation so use caution when taking trades during this time. It is better to wait for the price to hold above or below both VWMAs and stay supportive there before taking trades. Waiting for volume to increase is also a good way to avoid chop after the trend decides a direction.
This indicator will repaint sometimes before the candle has closed, so either wait for the candle to close with a signal before entering trades or only take signals before it closes on candles with good volume and technical analysis backing it.
***ALL THE FEATURES YOU NEED***
Trend Friend has multiple features designed to help you trade better and make decisions faster.
Buy & Sell Signals - When the algo detects all of our required parameters lining up on a single candle, Trend Friend will give Bull or Bear signals on the chart. Bull means upward price action is expected. Bear means downward price action is expected.
Take Profit Signals - When the price action makes a move that typically signals a reversal, a take profit signal will show up on the chart to help you get out of a trade before the next signal comes in.
Risk Levels For Signals
There is a risk detection system that tells you how risky each signal is as it comes in to help you stay out of dangerous trades. Wait for signals with low risk and you’ll be much safer than trying to take trades against the trend.
Alerts - There are options for alerts on buy signals, sell signals, take profit signals, price crossing the VWMA 100 and price crossing the VWMA 500. All of these can be controlled using tradingview alerts so you don't have to watch the charts and wait for things to happen. These alerts can also be used to send orders to trading bots if you choose.
Candles Painted Green Or Red According To Buy & Sell Pressure - By default, this indicator paints the candle sticks green, red or blue according to buy & sell pressure(DMI). You will need to turn off candle colors in your chart settings for this to appear correctly.
Percentage Updates - The table on the right has live percentage updates so you don’t have to measure out every move you are expecting. It will tell you the percentage from closest fibonacci levels, percentage away from the VWAP, percent gain or loss from the last signal entry and percentages from your own trades that can be configured in the settings. These help you always know how much more you can squeeze out of a trade and where your position stands without having to switch screens between Tradingview and your broker constantly.
Moving Average & VWAP Clouds - We included two color coded volume weighted moving averages(VWMA 100 and VWMA 500) and a color coded RMA 10 moving average. We also have a VWAP dotted line and cloud so you can easily see the trend direction on the chart at all times. The cloud and moving averages will turn green or red in real time depending on whether price is above or below each moving average or the VWAP respectively.
Trend Detection Label - The top label on the percentage update table tells you if the trend for this timeframe is Bullish or Bearish as well as when the trend is undecisive with choppy price action expected.
Chop & Low Volume Warning Labels - When price action is choppy or there is very low volume compared to historic candles, a warning label will appear at the top of the screen so you know to use caution and stay out of trades during these times.
Auto Fibonacci Levels - The chart will automatically populate fibonacci retracement and extension levels. The percentage update table will also give you real time updates on how far away the next fibonacci levels are from the current price.
Bounce Zone - We also included a very long term moving average cloud(EMA 1000 and EMA 2000) that shows as purple on the chart. When price enters that cloud, you can expect a reversal in that area. If price was trending above the cloud, expect that cloud to act as support. If price was trending below the cloud, expect that cloud to act as resistance. When price is trying to break through that cloud in either direction you can expect price action to be choppy and big moves to happen once price gets supportive in that zone and breaks out.
Margin Multiplier - If you are using margin to trade, our margin multiplier will multiply all of the percentage updates by the margin level you input in the settings tab so your percentages will reflect the percentages in your account.
***HOW TO USE***
Scalp, Swing And Long Swing Mode
You can choose from scalp mode, swing mode or long swing mode in the indicator settings. It is set to scalp mode by default. Scalpers will want to use the scalp mode as it provides early entries and exits and is designed to catch every move quickly. Swing mode is designed to catch almost every move and filter out some of the noise so it will have less signals than scalp mode. Long swing mode is designed to catch those lengthy moves and will hold positions the longest but give entries later than the other modes.
Try all three on a few charts and timeframes to see which setting matches your trading style the best. If you want more signals with any of the 3 modes, go to a lower timeframe. If you want less signals on any mode, go to a higher timeframe.
Bull & Bear Signals - When all of our algo parameters line up, a BULL or BEAR label will print on the chart. Bull labels will be colored green and bear labels will be colored red. Bull indicates a good place to enter a long trade because the algo is detecting patterns that indicate price should move upwards. Bear indicates a good place to enter a short trade because the algo is detecting patterns that indicate price should move downwards.
For best results using these signals, take trade signals that line up very closely with fibonacci levels or volume weighted moving averages or the vwap or any combination of them. It is also recommended to only take trades in the direction of the trend to avoid trading false reversals. Wait for low risk signals using our risk identifier and then enter the market. Waiting for good volume to come in will also help you avoid chop and catch those quick moves.
Also, make sure to check the percentage updates table to see if the expected move to the next fibonacci level is far enough away to make the risk to reward ratio worth taking the trade. Watch for signals when the VWMAs squeeze together after a wide gap and price breaks out with a corresponding signal as these can bring large, quick moves in price. Use caution when the VWMAs are close to each other and trending sideways as this usually brings choppy price action.
(The bull and bear signals can be turned on or off in the indicator settings input tab. Useful if you want to clean up the chart or only show bear or bull signals according to the trend.)
Take profit Signals - Take profit labels will show up on the chart when a reversal candle pattern or reversal indicator pattern is detected while a trade is still open. Use these signals as times that it may be a good point to exit the trade to avoid losses or reduced profits.
(The take profit signals can be turned on or off in the indicator settings input tab.)
Risk Level Label
Taking trades against the trend is dangerous because there are more false bottoms than there are actual bottoms. Our risk detection label is there to keep you from taking dangerous trades against the trend. The label will say Low Risk when the trend is in the same direction as the last signal given. The label will say Medium Risk when the trend is neutral because price likes to chop around during these times. The label will say High Risk when the trend is in the opposite direction as the last signal given.
Make sure you wait for the risk level detector to show Low Risk before taking trades or you may be buying a false bottom.
Candles Colored According To Buy & Sell Pressure - By default this indicator will paint the candlesticks green, red or blue depending on the buy & sell pressure for those candles using the Directional Movement Index or DMI. If buy pressure is higher than sell pressure, it will paint green. If Sell pressure is higher than buy pressure, it will paint red. If buy pressure is equal to sell pressure, it will paint blue. Use this to confirm which direction buying and selling is favoring and use a change in color trend to determine reversal points early. For this to work correctly you will need to go into chart settings(gear icon top right) and in the symbol tab turn off body, wicks and border.
(The buy & sell pressure candle coloring can be turned on or off in the indicator settings input tab.)
Auto Fibonacci - This indicator will automatically populate fibonacci retracement and extension levels for you. These levels are calculated using the previous high and low. You can switch the source between the previous day, week, month, quarter and year(the weekly setting is the default as it is great for day trading). The previous high and low levels will show as white(These are very important levels so watch for price to bounce off of the white lines). The percentage update table will also show the percentage gap from the current price and the next closest fibonacci level above and below, with labels telling you which fib levels they are.
(The fibonacci levels can be turned on or off in the indicator settings input tab.)
Volume Weighted Moving Averages With Clouds - The red or green moving averages should be treated as dynamic support and resistance as well as a visual way of telling current price trends. You can expect price to bounce off of these moving averages very often and quick moves usually happen when price breaks out of these moving averages.
The safest long trades you can take will be when the VWMA 100 is above the VWMA 500 and you get a BULL signal that is very close to the VWMA 100 or VWMA 500. The safest short trades you can take will be when the VWMA 100 is below the VWMA 500 and you get a BEAR signal that is very close to the VWMA 100 or VWMA 500.
When the moving averages squeeze together and price bounces between them, you can expect big moves in price when it breaks out. If price has been trending up and the moving averages squeeze together, expect the price to fall quickly once it breaks down from there. If price has been trending down and the moving averages squeeze together, expect the price to jump quickly once it breaks out from there.
These moving averages and the clouds associated with them will paint green when price is above them, indicating a bullish trend and they will change to red when price is below the moving averages, indicating a bearish trend.
You can also use the moving averages as support and resistance levels when markets are moving sideways. Since these are volume weighted moving averages, price tends to stick to them very well and paints a much clearer picture of what is going to happen than regular moving averages that don't take volume into account. Try it on a bunch of different timeframes and charts to see for yourself.
(The moving averages and clouds can be turned on or off in the indicator settings input tab.)
Bounce Zone - The bounce zone is a purple cloud that is made up of two very long term moving averages. When price is trending above this cloud and comes back down to it, you can expect the price to bounce back upwards in this zone. If the price is trending below this cloud and comes up to it, you can expect the price to bounce back downwards when it reaches this zone.
Sometimes price will break through this cloud and you will usually notice a lot of choppy price action and accumulation in this zone. When price does break out of it, you can expect fast, large moves. I also like to call this zone the safe zone because taking trades in this zone is typically a very safe place to enter trades depending on how the price is trending before it entered this zone. If you look at the cloud on any of your favorite charts, you will see that the cloud usually represents support and resistance areas quite well.
(The bounce zone can be turned on or off in the indicator settings input tab.)
Chop & Low Volume Warnings - When price is choppy, it can be a portfolio killer. When volume is low, it can give false signals or the market can reverse easily, so stay out of trades when these warning labels appear on your chart. If you were already in a trade when these warnings appear, keep a close eye on your trades and be ready to exit if things start to go the wrong way.
Long & Short Entry Calculator - Here you can enter your own entry price for short or long positions so that your actual P&L will be shown live on your chart. This eliminates the need to calculate percentages in your head or switch screens to your broker often or use the measuring tool to calculate your P&L. These will show as zero until a trade price is entered.
Margin Multiplier - If you use margin to trade, enter your margin multiplier in this input and all of the percentages in the percentage update table will reflect how far each level is based on your margin. So a 5x margin will multiply all percentages in the chart by 5 and so on. This way you don’t have to calculate everything in your head or switch between your chart and your broker constantly.
Customization - Go into the indicator settings and you can customize just about everything to suit your style. In the Input tab you can: turn the Bull or Bear labels off or on so you only get the signals that are going in the direction of the trend, turn on or off the moving average lines & clouds, turn on or off the vwap & clouds, set your fibonacci timeframe or turn them off completely and set your long or short entry price as well as your margin level for percentage updates according to your portfolio.
You can also easily customize: the moving average lines & clouds, the bounce zone lines and cloud, the vwap color and line style, the support and resistance line colors and thickness, the bull and bear label styles, the take profit label styles and more.
***MARKETS***
This indicator can be used as a signal on all markets, including stocks, crypto, futures and forex as long as Tradingview has enough data to support the calculations needed by the algo.
***TIMEFRAMES***
Trend Friend can be used on all timeframes.
***IMPORTANT NOTES***
For the buy & sell pressure colored candles to show up properly you will need to go to the chart settings(gear icon in top right corner) and in the symbol tab turn off body, wicks and border.
No indicator can be right 100% of the time and remember that past results do not guarantee future performance. You still need to make smart decisions when using this indicator to be successful. It is also important to note that markets with little volume and price action may not give very good signals due to many different parameters needing to line up on one candle for a signal to be given so use it on high volume tickers with lots of price action for best results.
***TIPS***
Try using numerous indicators of ours on your chart so you can instantly see the bullish or bearish trend of multiple indicators in real time without having to analyze the data. Some of our favorites are our Volume Spikes, Directional Movement Index + Fisher, Volume Profile with DMI, and MOM + MFI + RSI with Trend Friend. They all have real time Bullish and Bearish labels as well so you can immediately understand each indicator's trend.

TWAP + MA crossover Study [Dynamic Signal Lab]Dear TV'ers,
Hereby the study for the TWAP/moving average crossover, with taking profit options.
moving averages include: EMA , WMA , DEMA , TEMA , VAR, WWMA, ZLEMA , TSF , HULL, TILL
It is also possible to gradually take profit, using:
* minimum consecutive green/red candles
* minimum amount of green/red candles in the last 2-8 candles
* both of the above criteria
The slightly transparent green fill shows how much you are in profit from your entry point
The current default properties should be modified to make this strategy cost-effective, but typically 15 minutes and higher timeframes (up to 6hr) seem to work well for larger (top10 cap) crypto projects. Don't use this script for small-caps as it will get you rekt, due to wild volatility.
Additionally, you'll also be able to continuously take profit, making sure you lock in all those sweet profits. For backtesting: use the strategy version of this script

DMT TEMPELTON PECKIntroduction
Bring your A-game to the market in A-Team style with DMT Templeton Peck – you’ll love it when this plan comes together!
Using customized standard deviations between historic price action ranges and volume metrics, DMT Templeton Peck enables traders to never miss a change in trend.
In its default state, the DMT Templeton Peck indicator displays key information, such as:
• Small trend line
• Large trend line
• Position entry prices
• Take profit levels
• Stop levels
• Buy and sell trend signals
In addition to providing core functionality for the indicator’s strategy signals, traders can use this data to enter or exit trades.
When price crosses both trend lines and consolidates there is a high probability that price will continue to move in the same direction. The most profitable results are achieved when trading in the direction of the current large time frame trend.
When small and large trend lines cross a trading signal is generated which can be used to automate trades. Please see the ‘TradingView Alerts’ section of this document for further details.
The Small & Large trend line’s display can be toggled, and their colors modified in the indicator’s style options as shown below.
Basic Strategy
In its simplest form, the strategy is to buy when the price crosses and consolidates above both trend lines and sell when the price crosses and consolidates below both trend lines.
How to Trade
Confident traders may choose to enter a long position at the point
#1 when the price passes above both trend lines and begins to consolidate.
However, the safer trade is to wait for the trend lines to cross at a point
#2 and then look for an entry in the direction of the local trend.
One price action begins to reverse to the downside the strategy reverses. Confident traders may choose to enter point
#3 when the price passes both trend lines and begins to consolidate once again under the previous price action structure that is now acting as resistance.
A sell signal is generated at the point
#4 which produced a small profit; however, a new short position could have been opened when the price retraced to resistance at a point
#5 and experienced a repeated number of strong rejections.
Do not worry if you miss a trade as there is often more than a single opportunity to enter – like at position #5 when price action retests the previous local price structure as resistance.
The indicator can be used on smaller time frames to scalp or find an entry after a larger time frame has signaled, however smaller time frames will also be “choppy” and should only be traded with a paper-tested strategy.
Traders should take profit on positions at resistance & support levels and look to have fully exited the trade by the time the price crosses back over both trend lines and/or loses a previously established price level.
Indicator Tuning
In its default state the indicator is tuned for swing trades using 30 minute & 1 hour time frames, however, you are encouraged to experiment with the indicator options.
Large & Small Length options define how many historic candles are used for the calculation of the relevant trend line.
As a rule of thumb, larger time frames would use smaller values and smaller time frames would use larger values, ie. On a daily chart, a large and small length could be defined as 400 and 100 respectively.
Please be aware that there are limits to the amount of historical data for any intraday level based on your TradingView subscription level:
• Basic – 5000 bars/candles
• Pro & Pro+ - 10000 bars/candles
• Premium – 20000 bars/cables
TradingView Alerts
By utilizing TradingView alerts DMT Templeton Peck's long and short signals can be used to trigger a trading bot.
To trigger a long position, set the TradingView Alert Condition to the DMT Templeton Peck indicator and select the ‘Long’ trigger condition with the ‘Once Per Bar Close’ option for best results.
To trigger a short position, set the TradingView Alert Condition to the DMT Templeton Peck indicator and select the ‘Short’ trigger condition with the ‘Once Per Bar Close’ option for best results.
Take profit options ‘Long_TP_1’ / ‘Short_TP_1’ and Stop options ‘Stop_long’ / ‘Stop_Short’ can also be configured in the same manner to conditionally trigger a trading bot and can be configured in the indicators Input options.

Technimentals RobotThis robot includes multiple trade signal algorithms and technical overlays. With tools for all markets and trading styles, access original and beautiful charting tools that work for you.
Flexible and robust trend detection & confirmation
Maverick mean reversion signals
Immensely customizable settings for all markets
Indicator prediction zones, perfect for options traders
The most beautiful bands in the world
As of this update, Technimentals Robot includes:
Queen Mary - A powerful mean reversion algorithm which compares the performance of the chart against the performance of a user-chosen benchmark. She uses short term mean reversion optionally combined with longer term trend following logic to detect possible deviations and thus unique pivot points which may lead to short term reversals or continuations of trend.
Brian - An agile and fully customizable trend following algorithm which uses various filtering systems to hone signals.
Prediction Zones - Projections of future price levels and indicator levels, currently featuring RSI and MFI.
Volume Weighted Filtered Bands - The most beautiful bands in the world.
...and much more! Check the change log below for new features.
Technimentals Robot is an all-in-one suite of indicators designed to be used as a standalone trading system. The backbone of this indicator is the trade signal generation. However, blindly following trade signals without context is unwise and that's where the supplementary bands and Prediction Zones come in. The signals are designed to be used primarily for entry signals; the bands can be used to determine whether or not a chart is overextended (and worth stopping out or profit taking) or not. The Prediction Zones are built in particular for those wishing to trade these signals via options due to the quantifiable nature of their predictions, but they too can be used to add an extra data point for knowing which areas of support & resistance to use when determining take profit and stop loss locations.
Sub-Component Descriptions:
Queen Mary
Queen Mary is a versatile trading signal generator which uses another symbol as a benchmark to build trading signals for your chart.
Queen Mary works by detecting whether or not there are sustained divergences and alerts the user via trade signals for when reversions to the mean are expected.
A typical use case for Queen Mary would be to set her to run on a technology stock with a technology ETF as the benchmark, but you use any pair of your choice.
Buy signals on the chart simultaneously indicate sell signals in the benchmark.
This can be used for pairs trading and long/short portfolio strategies.
Suppose the following; you’ve applied Queen Mary to a chart of AAPL and are using XLK as the benchmark. A buy signal for AAPL would also indicate a sell signal for the XLK. The user could then long AAPL and short XLK the same dollar amount, expecting a reversion to the mean.
Brian
Brian is a flexible trend following algorithm which uses multiple filtering techniques to hone entries and exits.
Brian has been designed to catch every major trend without fail. The inevitable problem all breakout or trend following algorithms face is their propensity to get chopped up during sideways market action. Brian addresses this problem via the ‘Risk’ setting which allows the user to determine the market conditions via a risk/reward standpoint.
During periods of sideways action, the risk setting should be increased. This will reduce the number of signals Brian gives and increase the odds of the breakout leading to a continuation.
Brian signals profit taking signals via blue flags. These always occur at a user defined risk to reward ratio. Partial profits should always be taken as soon as these flags occur. It is advised to use a user-defined trailing stop loss on the remaining position which suits the user’s own risk preferences.
Prediction Zones
Prediction Zones predict zones of indicator and price levels into the future.
Currently featuring the Relative Strength Index and the Money Flow Index, Prediction Zones will display at what future prices these indicators will reach user defined outputs.
A classic use-case example of this would be for options traders as these zones can be used as support and resistance areas. For example, if you believe the daily RSI won’t reach below 30 before the end of the week, you can use this zone as another data point for deciding where to put your short strike.
The zones can be shown into the past too so you can see how they behaved on historical data.
Volume Weighted Filtered Bands
These bands are built by firstly using a volatility and short term range detection algorithm and plugging this into three different lengths of smoothing filters. The output is then combined and filtered one last time before being coloured and plotted as multiple bands.
They can be customized to suit any trading style, but were built with scalp traders particularly in mind. It’s rare for prices to deviate from these bands for long.
A typical use case for these bands would be to trade with the trend while price is trading cleanly inside and in the same direction as the bands. Profit taking should typically be considered when price exceeds the bands, although this will depend on the settings chosen by the user.
The bands can also be used to gauge volatility (with an unusual increase in width) and volume (increased brightness).
The brightness of the bands are determined by volume, the brighter the bands are, the greater the volume.
Queen Mary
Brian
Most of the above images were carefully chosen, others were not. No indicator or strategy is perfect. Trend following algorithms will inevitably experience chop. Mean reversion algorithms will inevitably miss out on the big moves. Our tools aim to give you the data to help you determine which signals to act upon.
You are responsible for your own trading decisions. Trading signals are worthless if you do not have a clear plan, including exit targets and risk management. If you do not have these, you should study them seriously before considering fancy indicators. This indicator is probably unsuitable for beginners.

SIVE 2.0SIVE 2.0 IS FINALLY HERE, after the long awaited update we are finally able to bring to you SIVE 2.0!
SIVE 1.0 (Systematic Institutional Volatility Expansion) brought a whole new approach to the algorithm and retail trading game on TradingView. Never before have you had access to a quantitative institutional approach like this, after years in development and testing we finally brought SIVE 1.0 to market. With very very high demand, support and so much positive feedback we knew that what we've created really hit the mark for so many traders!
What is SIVE?
SIVE as stated above stands for, Systematic Institutional Volatility Expansion. What this means is we have a highly effective system that reads what institutional algorithms are proven to be looking at. While only providing alerts during periods where Volatility is Expanding
We don't shy away from volatility here, that is where the bread and butter lays. volatility is a double edged sword that not many people know how to effectively use to their advantage. Simply put, because they are told in their retail trading that volatility is risky, and that you should stay away from volatile products. I say embrace it with the right tools.
What Has Changed?
At the core, SIVE 2.0 brings more efficient calculations to the volatility modelling as well as the triggering of trades!
Trend Scalper - This is a sub-set strategy we have included, what it measures is 'Super Trend' with a deviation of 7 and the MTI ribbon crosses. This is to be used as a way to scalp and trade the momentum of the market. I am aware that another brand/community has put this out as a paid feature to their algorithm. Since they didn't want to credit me for my contribution I decided to release it for free and also add it here. This is listed in my scripts as a free to use access.
Volatility Confluence - We have now also added a feature where you can choose how many volatility models you want to be aligned before SIVE calls an alert. There are a total of 9 models we have included, example. You choose 3 'Volatility Confluence', this means that SIVE will only call alerts when 3 of those 9 models agree. This can be very effective if you want to have more refined volatility trades, giving you more confidence that an expansion will take place.
Low Volatility Flashes - You now have the ability to control the low volatility back ground flash feature that was included with SIVE 1.0
Volatility Candles - You can now plot the volatility strength as candles! before you weren't able to see the actual underlaying volatility. Till now, turn this on and watch it turn you candles into a colourful array of the rainbow based on the volatility. Note - You will either need to *bring to front* or turn off the price data to see it
Take Profit System (beta) - Before on SIVE 1.0 and in the beta versions we had an early version of the money management. Where based on the ATR on the trade it would give you a suggested Stop Loss and Take Profit area. Now we have completely over hauled that and re calculated how we approach this also giving the trader 2 different options to choose from for suggested Stop Loss placement. We also included a 'Dynamic Take Profit' system that's based on the MTI to give you momentum based Take Profits. These are still in beta stages so any feedback is much appreciated and as always will be reviewed and considered.
RSI bands - Reverse plot the RSI onto your chart. Plot the over sold and over Bought static lines to price!
Moving Average Filter (Multi Time Frame) - Introducing a way further refine the trade alerts and give more power into the traders hands. We know that many many traders like to only trade if example. price is Greater Than 200 EMA . We wanted to give traders a choice to refine the trade alerts based on this information. You can choose between 'Price vs MA' - which is explained in that example just provided. The other option is 'MA vs MA', this allows you to filter out trades based on if a Moving Average of your choice(MA1) is Greater than MA2. With all this we also provided Multi Time Frame accessibility to just further give the trader more control and range. You also have the ability to just plot the Moving averages and not filter the trades at all!
Kill Zone / Time Sessions - Including another free script that has already been posted to my account. This script is also unique as it plots the specified time zones 24 hours in advanced. If you trade example. 'New York Session', Instead of using an indicator that only shows you after the fact it happens. You can now plot that time zone 24 Hours in advanced and watch how price trades to it and interacts with it. It has 4 completely customizable Time Zone slots. Please adjust to your time zone and desired sessions.
Here are some examples of SIVE working across various charts with the different features
USDCAD - 1 Hour
Take Profit System
XAUUSD(Gold) - 15 min
Trend Scalper System
US30(Dow Jones) - 15 min
Volatility Candles + Low Volatility Flashes
BTCUSD(Bitcoin) - 1 hour
Support / Resistance + Dashboard + Multi Time Frame MTI
USOIL(WTI Crude Oil) - 5m
Kill Zones + Moving Average Filter
APPL(Apple) - 1 hour
Moving Average Filter
Please report any bugs, feedback or suggestions you have about SIVE to myself or in the Discord so we can review it and take action!
If it isn't Soldi, it isn't money

Day Trade Scalping - Optimal Trade Entrance IndicatorThis script can be used to day trade SPY ( S&P ), Forex Currencies, Stocks, Bitcoin and pretty much anything out there. It was extensively tested trading live on 15minute timeframe with great results, it can be used with other timeframes as well.
Indicators:
- Regular Signals (red/green) – trade signal arrows, includes alerts
- Risky Signals (orange/olive) – trade signal arrows, includes alerts
- Optimal Trade Entrance Area - target at where to enter the trade with minimal risk and maximum profit
As the signals explained, there are regular and risky signals, which are calculated per different algorithms. Based on the test run, risky signals will appear less and be more risky, but usually spot longer bigger runs!
The original idea of the script is to provide the trader with an Optimal Trade Entrance Area to reduce the risk and maximize the profit. After you receive a signal/alert, wait for the price to re-trace to the Optimal Trade Entrance Area line, which will be shown on the chart. If the price does not reverse - it's best to not open a position. (Remember that the best trade is – no trade!).
If you don’t know how to divide up your position - here is an example on how I take profits between the price targets:
- Open position with buying a multiple of x3 contracts
- Sell 1/3 of the position at first price target and move my SL to entry
- Sell 1/3 of the remaining position at a second price target
- Sell the rest of the position at the third price target or scale out slowly if the trend is still strong
Also, keep an eye on the breakouts, especially if they go along the script signals as with breakouts, there is a good potential for a bigger move.
Volume Based Ichimoku CloudIntroduction
This release focuses primarily on a volume-based Donchian. For some time I was looking for a volume-based Donchian, not finding anything that satisfied me I tried to apply one, and then I applied it to Ichimoku.
I found advantages especially in the lateralization phase, where the integration with the volume filters some false signals.
I have added some features:
- Check the conditions of buy/sell of classic Ichimoku
- Verified reverse buy/sell condition
- Alerts
- Entrance package
- possibility to choose the type of Donchian to use (classic, volume-based)
Settings
There are the classic parameters of Ichimoku, for scalping, I use setting like(6-17-34-17 or 5-14-28-14), the new parameters are:
Donchian Type : Classic / Volume Based
Show Condition : it shows green/red square on the bottom when all the conditions of Ichimoku are satisfied, without the checkmark the inputs or the alarms will not work for this type of signal
Show Reversal : it shows yellow/purple triangle on the bottom when all during short/long state condition of Ichimoku Tenkan cross the Kijun, without the checkmark the inputs or the alarms will not work for this type of signal
Trades Framework
Show Trade Lines : show the lines for Entry Point, TP1, TP2, SL
Per n Bars : For how many bars the sending lines will be drawn
Enter Gap : It's the gap, in percentage, from the last candle low/high. For example, the entry point will be set 0.1% higher than the last high of the candle, in a long situation, or 0.1% lower than the last low of the candle in a short situation.
Take Profit 1 : It's the gap, in percentage, from the entry point. For example, the first take profit will be set 0.5% higher/lower than the entry point.
Take Profit 2 : It's the gap, in percentage, from the entry point. For example, the second take profit will be set 0.5% higher/lower than the entry point.
Stop Loss : It's the gap, in percentage, from the entry point. For example, the stop loss will be set 0.5% higher/lower than the entry point.
How to use
The use will be like that for the classic Ichimoku, the combination with a volatility indicator or the volume analysis will certainly help to reduce false signals and therefore to select only the most profitable signals.
Remember that every statistical indicator is just a tool, it needs to be understood to be used at its best, otherwise, it is just a colored line in a colored graph.

Data Trader Stoch | RSI | MACD Strategy IndicatorImplementation of Data Trader's strategy, described in the youtube video, "Highly Profitable Stochastic + RSI + MACD Trading Strategy (Proven 100x)"
Also see Algovibes' video, "Highly Profitable Stochastic + RSI + MACD Trading Strategy? Testing Data Traders strategy in Python"
Note: Despite the claims, it generates barely, if any, signals, certainly in the crypto markets
If there are any mistakes, give feedback in the comments, and I'll fix
### Strategy Summary ###
# Long Signals #
Stoch K and D are oversold
RSI above midline
MACD above signal line
# Short Signals #
Stoch K and D are overbought
RSI below midline
MACD below signal line
# Stop loss and Take Profit #
Stop loss
Longs: below last swing low
Shorts: above last swing high
Take profit at 1.5x stop loss
AI Crypto Signals BTCUSD 15m Ultimate ScriptBYBIT:BTCUSD
Hello everyone! Sky First Capital in partnership with AI Crypto Signals is proud to introduce the AI Crypto Signals 15M BTCUSD Ultimate Script . This script works well on the 15M, 30M, 45M and 1HR chart using traditional candles. This means no false data or inaccurate entry/exit points such as with the ones using HA candles.
The script is based upon an initial strategy developed by user Bunghole here on TradingView, but we have optimized it, back-tested it with ideal settings, and added alerts that you can use to connect with your trading bot such as Alertatron, Cornix, etc. This script uses BB (Bollinger Bands) and RSI (Relative Strength Index) as indicators for signals.
Back-testing data for the 15M chart from 7/1/2021 to 10/15/2021 showed a 51.19% profit.
Back-testing data for the 1HR chart from 7/1/2021 to 10/15/2021 showed a 191% profit.
This script does not repaint.
Ideal use is to enter and exit at the close of the candle and take-profit/stop-loss once per candle.
This script has Entry/Exit/Take-Profit/Stop-Loss alerts.
We offer consulting and training services if you need help on using this script or getting it configured with an automated trading system.
We offer a 24 hour free trial of the script, send us a message to request access.

Mid to High daily % - MA & ThresholdPurpose of this script is to provide a metric for comparing crypto volatility in terms of the % gain that can be garnished if you buy the midpoint price of the day and sell the high***. I'm specifically using bots that buy non-stop. This metric makes it easy to compare crypto coins while also providing insight on what a take profit % should be if I want to be sure it closes often instead of getting stuck in a position.
Added a few moving averages of (Mid-range to High Daily %). When these lines starts to trend down, it's time to lower the take profit % or move on to the next coin.
Decided to add a threshold so I could easily mark where I think the (Mid-range to High Daily %) is for most days.
Ex. I can mark 10% threshold and can eyeball roughly ~75% of the days in the past month or so were at or above that level. Then I know I have plenty volatility for a bot taking 5% profit. Also if you have plenty of periodic poke-through that month (let's say once a week) you might argue that you can set it to 7% if you're willing to wait about that long. Either way this metric is conservative because it is only the middle of the range to the high, a less conservative version might provide the % gain if you bought the day low and sold the day high.
***Since this calculation only takes the middle of the range and the high of the day into account, red days are volatile against a buyer but to your advantage if you are a seller. BUT if you have plenty of safety buy orders this volatility in price only means your total purchase volume increases and when/if you reach a take profit level you sell more there.
Would like to upgrade and add a separate MA line for green days and a separate MA line for red days to discern if that particular coin has a bias. Also would like to include some statistics on how many candles are above or below threshold for a certain period instead of eyeballing.

AlgotrdrAlgotrdr is an indicator designed around 3 features that work together on any asset, and on all timeframes, to help you achieve profitability while trading. Let’s take a look at what the three features are.
Signals
This indicator’s signal feature has a proprietary trend algo that uses our own trend strength feature, multiple moving averages, volume, candle data, and fibonacci levels. When a candle meets the base signal requirement it then uses a dynamic bullish and bearish score from our Volume Trend Strength algo to either plot the signal or wait for another. You can also do another cross check and only plot signals that align with a larger MA defined trend.
Volume Trend Strength
This feature tracks the current trend strength. It analyses Volume, VWMA, Mcginley Dynamic MA, differences in price, and recent retraces going against the trend to print bullish/bearish colors that get darker as the trend gets stronger. It also turns yellow when there isn’t enough volume supporting the current trend, which can indicate an upcoming trend reversal. This feature can be switched to appear as a color changing MA.
Take Profit / Pivot Levels
Prints Tradingview’s Fibonacci Pivot Points on the chart to help users identify potential take profit and S/R levels. I also added 4th and 5th S/Rs that use 1.618 and 2.618 levels.
Aside from the signals the other two features come with an off switch incase you don’t want to use either of them.

Parabolic SAR + %Take Profit and %Stop Loss By NussaraThe parabolic SAR is calculated almost independently for each trend in the price. When the price is in an uptrend, the SAR emerges below the price and converges upwards towards it. Similarly, on a downtrend, the SAR emerges above the price and converges downwards. At each step within a trend, the SAR is calculated one period in advance. That is, tomorrow's SAR value is built using data available today. The general formula used for this is:
SAR n+1=SAR n+ α (EP-SAR n)
where SAR n and SARn+1 represent the current period and the next period's SAR values, respectively.
EP (the extreme point) is a record kept during each trend that represents the highest value reached by the price during the current uptrend – or lowest value during a downtrend. During each period, if a new maximum (or minimum) is observed, the EP is updated with that value.
The α value represents the acceleration factor. Usually, this is set initially to a value of 0.02, but can be chosen by the trader. This factor is increased by 0.02 each time a new EP is recorded, which means that every time a new EP is observed, it will make the acceleration factor go up. The rate will then quicken to a point where the SAR converges towards the price. To prevent it from getting too large, a maximum value for the acceleration factor is normally set to 0.20. The traders can set these numbers depending on their trading style and the instruments being traded. Generally, it is preferable in stocks trading to set the acceleration factor to 0.01, so that it is not too sensitive to local decreases. For commodity or currency trading, the preferred value is 0.02.
-If the next period's SAR value is inside (or beyond) the current period or the previous period's price range, the SAR must be set to the closest price bound. For example, if in an upward trend, the new SAR value is calculated and if it results to be more than today's or yesterday's lowest price, it must be set equal to that lower boundary.
-If the next period's SAR value is inside (or beyond) the next period's price range, a new trend direction is then signaled. The SAR must then switch sides.
Upon a trend switch, the first SAR value for this new trend is set to the last EP recorded on the prior trend, EP is then reset accordingly to this period's maximum, and the acceleration factor is reset to its initial value of 0.02.
I previously released a script called "Parabolic SAR + Take Profit and Stop Loss By Nussara" which I used Parabolic SAR to enter an order and set a stop loss on the first SAR value of uptrend and users can fixed reward for taking profit. This script I use the order entry the same method as "Parabolic SAR + Take Profit and Stop Loss By Nussara", but I use the % of entry price to calculate take profit and stop loss.
Stop loss = Entry Price * (1 - stop loss)
Take profit = Entry Price * (1 + take profit)
This indicator is just a tool for technical analysis . It shouldn't be used as the only indication of trade because it causes you to lose your money. You should use other indicators to analyze together.

Gap RiderThis Indicator allows you to make statistics on the performance of any underlying on the days in which an opening gap occurs.
Specifically, the indicator was designed for "0 dte" options trades. In fact, it is possible to find parameters that give a good statistical advantage by opening a spread in the direction of the gap, creating a trade that has a risk-return ratio of 1: 1.
The indicator shows flags on the graph (green in case of gap up, red in case of gap down) and colored boxes (green in case the stock closed in the direction of the gap, red in case the stock closed in the opposite direction to the gap, yellow in the event that the stock closed at a distance that did not allow the spread in options to close in maximum loss or maximum profit, and therefore in breakeven)
The statistics panel, on the other hand, contains all the information necessary to search for parameters that give the trader a good statistical advantage.
In the settings you can filter the days of the week, only gap up or only gap down, ATR thresholds (volatility), points or minimum percentage for which a gap is taken into account, measure of the breakeven (which for options traders should represent the half the width of the spread to open), large gaps filter that takes into consideration only gaps that open out of range compared to the previous session. The Lookback parameter of course is used to set how many bars to take into account for the statistics.
Parameters and recommended strategy:
TODAY 31/08/2021 - Lookback 500 bars (2 years)
UNDERLYING: SPX
FILTERS: only Monday and Wednesday, only gap up, only gap> 0.01%
STRATEGY: exactly at opening, cover an ATM spread in the direction of the gap (example: gap up, I open a long call spread) that has the opening price as a break even, with a risk-return ratio of 1: 1 and leave it open until closing session, or set take profit at 90-95%. It is advisable to take into consideration the SPX statistics but to operate on the ES future so as to be able to open the spread a couple of minutes before the opening of the cash session and prevent the trade from "running away" due to too sudden movements of the opening. .
RESULTS:
124 Trade
70% profitable trades
30% losing trades
Max drawdown 3 trades
So assuming a spread on ES 10 points wide, each trade would gain or lose $ 250, applying the described strategy we would have in two years, investing only $ 250, a profit of $ 12500, with a max drawdown of $ 750. We would therefore have a profit of 5000%, or rather 2500% per year on the invested capital, with a drawdown of a much lower proportion of the profit ($ 750 compared to $ 6250 of annual profit).
The strategy is infinitely scalable by increasing the options contracts used and the impact of the commissions is almost zero.
MONEY MANAGEMENT: Example on a 50K account, with a spread that earns or loses $ 500, in two years it earns $ 25,000, therefore about 12500 per year, with a max drawdown of $ 1500, therefore 25% per year on the ENTIRE ACCOUNT with a maximum drawdown of 3%.
Note: the test was performed without a break even parameter, so the actual result will be more moderate, but of the same explosive nature.
** BUG STILL LOOKING FOR SOLUTION **
only in case the filters are set to take into account ONLY the gap down, the drawdown count in the statistics panel shows an incorrect result "

KV Box v1.0 - Buy / Sell signalKV BOX is a trading indicator. It combines Darvas box theory (developed by Nicolas Darvas), breakout strategy, multi-timeframe trading and ALMA (Arnaud Legoux Moving Averages). This indicator helps identify BUY signals when the price is in the entry zone and SELL when the price breaks out of the uptrend.
---
How to use?
KV BOX can be used in both SPOT and FUTURE (Long/Short) trading
BUY (LONG):
• Entry: When the BUY signal appears.
• Stop loss: LOWER than LOW of first and second candlestick IN THE BOX WHERE BUY SIGNAL APPEARS of 1H, 4H, 1D timeframe.
• Take profit: When the SELL signal appears.
SELL (SHORT):
• Entry: When the SELL signal appears.
• Stop loss: HIGHER than the HIGH of first and second candlestick IN THE BOX WHERE SELL SIGNAL APPEARS of 1H, 4H, 1D timeframe.
• Take profit: When a BUY signal appears.
---
Attention:
KV BOX is only displayed on 1H, 4H and 1D timeframe. 1H for short-term trades (a few days), 4H for mid-term trades (a few weeks), 1D for long-term trades (weeks to months).
---
Options setting:
- Kelvin box on: KV BOX activates
- ALMA mode on: KV BOX activation according to Arnaud Legoux Moving Average (ALMA) method
- Pinbar indicator: activate the indicator when the pinbar candlestick appears
- Supertrend: trend continuation or reversal indicator
============================
KV BOX là 1 chỉ báo mua / bán kết hợp giữa nguyên lý hộp Darvas, phương pháp phá vỡ (break out), giao dịch đa khung thời gian và đường trung bình ALMA (Arnaud Legoux Moving Averages). Chỉ báo này giúp xác định tín hiệu mua khi giá ở vùng entry và bán khi giá phá vỡ khỏi trend tăng (up trend).
---
Cách sử dụng:
KV box có thể dùng trong giao dịch SPOT và FUTURE (Long/Short).
Mua khi có tín hiệu BUY, bán khi có tín hiệu SELL.
MUA:
• Entry: Khi có tín hiệu BUY.
• Cắt lỗ: thấp hơn giá thấp nhất cùa 2 nến đầu tiên trong hộp xuất hiện tín hiệu BUY của khung 1H, 4H, 1D.
• Chốt lời: Khi có tín hiệu SELL xuất hiện.
BÁN:
• Entry: Khi có tín hiệu SELL.
• Cắt lỗ: cao hơn giá cao nhất của 2 nến đầu tiên trong hộp xuất hiện tín hiệu SELL cùa khung 1H, 4H, 1D.
• Chốt lời: Khi có tín hiệu BUY xuất hiện.
---
Chú ý:
KV BOX chỉ hiển thị trên khung 1H, 4H và 1D. 1H cho giao dịch ngắn hạn (vài ngày), 4H cho giao dịch trung hạn (vài tuần), 1D cho giao dịch dài hạn (vài tuần đến vài tháng).
---
Tùy chọn setting:
- Kelvin box on: kích hoạt KV BOX
- ALMA method on: kích hoạt KV box theo phương pháp Arnaud Legoux Moving Averages (ALMA)
- Pinbar indicator: kích hoạt chỉ báo khi xuất hiện nến pinbar đảo chiều
- Supertrend: chỉ báo xu hướng tiếp diễn hoặc đảo chiều

The Chartless TraderThe Chartless Trader
The chartless trader is a trade management system designed to remove the randomness from the market. It is loosely based on the martingales betting system, but takes advantage of position sizing, minimum profit targets, dollar cost averaging, and trailing take profit.
The chart can be traded with or without a signal. There is a built in signal based on SB Master Chart's Buy the Dip algorithm.
The configurable settings include:
Account Value
Starting Account Value - This is the value of the account when you start using this system.
Current Cash - This is the amount of cash you have available to trade. This setting needs to be updated each time a trade is made.
TP/TTP Algo Settings
Take Profit % - This setting is otherwise known as minimum profit target. This algo will not advise you to sell or increase your trailing stop until this minimum profit target is met.
Trailing Stop % - This is the trailing stop. The default setting is 75%. As a basic example, if the stock is up 10%, the trailing stop would be set to 7.5% (10% * 75%). The algo may override and advise an alternative trailing stop should an overbought condition be detected.
DCA/BTD Algo
DCA/BTD Algo Time Frame - Default is 120 (2hrs). This algo looks for oversold periods on the 2h chart by default.
DCA % - The default for this setting is 5%. This is a trigger for the BTD Algo. The BTD algo will start looking for trades when the stock is 5% below your cost basis. This is to help you average down making it easier to turn a profit when the stock starts making gains.
Position #
The Chartless Trader supports a maximum of 20 symbols. This is a limitation of the security() function as a maximum of 40 calls are allowed and the script calls the security() function twice per symbol.
S# QTY - The number of open positions of the symbol. This has to be manually updated by the user after each buy/sell of the stock.
S# CB - This is the cost basis of the stock. Your broker should give you this after each buy/sell and it has to be updated here on the chart after each buy/sell.
S# TTP - The script will advise you to increase your Trailing Take Profit in your broker when its necessary. This should be updated manually after you update your order in your broker. This should be configured manually in your broker as a Stop Order.
Now that I have covered the configurable options, its important to understand the basis of this system. The martingales betting system is a system that seeks to double its position size each time you enter a losing trade. Eventually when you make a winning trade, it will be enough to cover the previous losses and net you one winning position.
Bet 1, lose 1, down 1.
Bet 2, lose 2, down 3.
Bet 4, lose 4, down 7.
Bet 8, lost 8, down 15.
Bet 16, win 16, up 1.
So the theory goes, if you have deep enough pockets, its a 100% win rate. Such a system is flawed and proven to cause an account to blow up given enough time. You can search Google/YouTube for others that have back tested the martingales system with stocks.
I advise that "The Chartless Trading" system be traded with a similar system, but instead of doubling your position, you simply increase your position size by 1%.
Bet 1%, lose 1%, down 1%
Bet 1%, lose 1%, down 2%
Bet 1%, lose 1%, down 3%.
In such a manner, your risk of ruin is significantly reduced. Lets say you lose 10 times in a row betting on a stock. You now have 10% of your account value in this particular stock. Because you only invested at times where you were more than 5% down and when an oversold position occurred, because of dollar cost averaging and buying during oversold periods, you may only be down 2-3% on your invested value. Eventually when the stock turns positive, you will have met your minimum profit target and the script will alert you to set a trailing stop. You log into your broker, set a stop loss and wait for it to either trigger or inform you to increase it again. Once the trailing stop is triggered, you deleverage the position by closing it and starting a single new position in either the same stock or a different one and the cycle repeats.
The key is to follow the stock down, follow it back up, and not back down. We repeat this cycle with many positions in many stocks to minimize risk and compound our balance sheet.
This is " The Chartless Trader ".
1920x1080p Monitor Required if using all 20 symbols.
The more symbols loaded, the longer the initial processing to load the table. Please be patient.
